
Helmledgers Insights · Shipping
Shipping risk often appears in the filings before it appears in earnings
Shipping cycles are easy to explain after the fact. The harder question is whether the pressure was visible before it became obvious in reported earnings. In shipping, it often is.
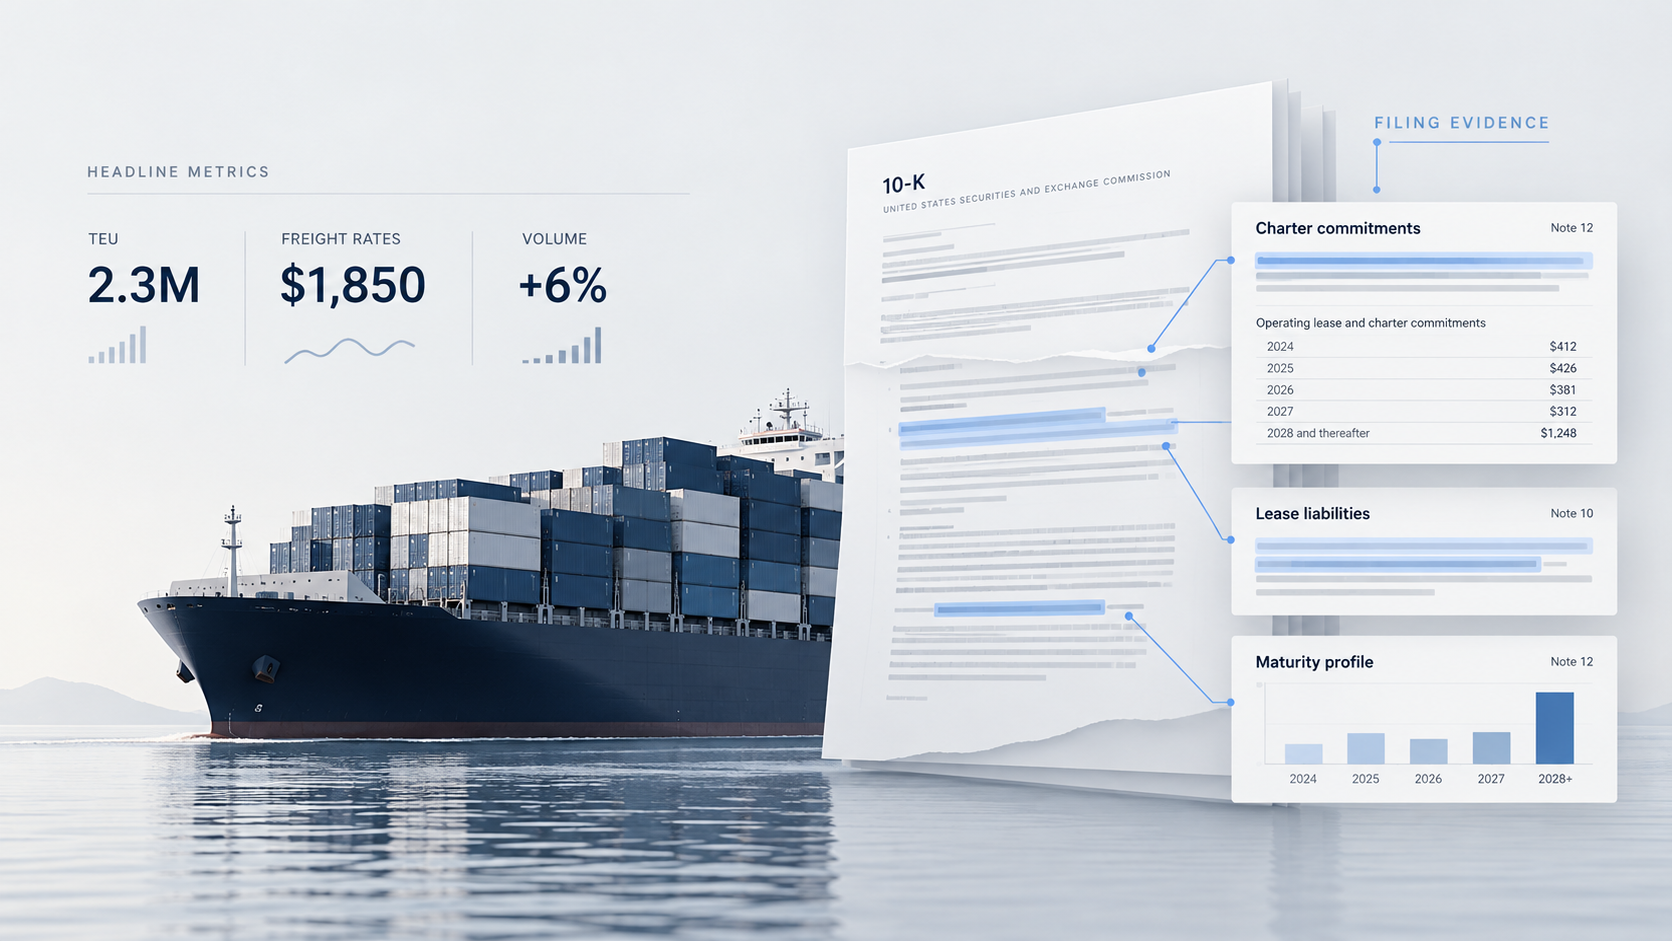
Volume can mislead
Twenty-foot equivalent units, or TEU, are one of the industry’s most familiar headline measures.
They tell you how much cargo moved.
They do not tell you whether that cargo moved at an attractive rate, whether the company earned enough to cover its fixed commitments, or whether the underlying economics improved.
A carrier can move more containers and still weaken financially if pricing deteriorates faster than volume grows.
That makes volume useful context, but a poor standalone measure of economic quality.
The more important questions sit underneath it:
- What rate was earned on the volume?
- What fixed capacity had already been committed?
- How much of the cost base can adjust if spot markets weaken?
- What does the company need to earn merely to cover those obligations?
That is where the cycle starts to become visible.
Charter obligations can behave like debt
One of the most important risks in shipping is the mismatch between fixed commitments and variable market revenue.
A carrier may enter into vessel charters when freight markets are strong.
Those commitments can remain in place long after spot rates have fallen.
Economically, that can create a debt-like burden even though the obligation does not always appear beside conventional borrowings in a way that immediately attracts attention.
When the market turns, the key question is not simply whether revenue is falling.
It is whether the revenue being earned today is sufficient to support commitments agreed under very different market conditions.
That pressure can often be traced through:
- charter commitments
- lease liabilities
- maturity schedules
- minimum payment obligations
- guarantees
- fixed versus variable charter structures
By the time negative operating leverage becomes obvious in EBITDA, the structure may already have been visible in the filing for several quarters.
Asset values can lag the cycle
Net asset value is widely used across shipping.
It is useful, but it is not instantaneous.
Broker valuations are based on observable transactions, comparable vessels and professional appraisal assumptions. In fast-moving markets, those values can lag the economics investors are trying to understand.
That matters most near turning points.
When freight rates are rising rapidly, reported or appraised vessel values may understate current economics.
When freight rates are falling sharply, those same values may remain elevated after the earnings power supporting them has already weakened.
The balance sheet can describe yesterday’s market while the equity is pricing tomorrow’s.
The more useful analysis therefore connects vessel values back to the operating environment that supports them.
The cycle lives in the mismatch
Shipping risk is often not contained in any single number.
It appears in the relationship between them.
Fixed charter cost vs. spot revenue
Can current freight economics support contractual vessel commitments?
Asset value vs. current earning power
Are vessel valuations consistent with the cash flows available in the present market?
Debt maturity vs. cycle position
Does refinancing arrive at the wrong point in the freight cycle?
Hedging vs. market exposure
How much downside has actually been transferred, and how much remains exposed?
The risk is in the seam.
That is precisely where conventional screening tends to be weakest.
Accounting changes can make comparison harder
The economics can remain the same while the accounting presentation changes.
A company transitioning between accounting frameworks, or changing how it presents leases, impairments, hedges or non-GAAP measures, can become harder to compare with its own history and with peers.
This is where automated screening often struggles.
A metric may still exist, but its meaning can shift because of:
- lease classification
- impairment methodology
- hedging presentation
- segment changes
- accounting-policy changes
- reclassification between operating and financing items
Those differences matter because a clean-looking time series can hide a broken comparison.
For an analyst, that means the question is not only:
What changed?
It is also:
Was the number measured the same way this time?
The footnotes often tell the story first
For shipping, some of the most important information can sit outside the headline income statement.
That includes:
- lease maturity tables
- charter commitments
- guarantees
- impairment assumptions
- debt covenants
- hedging disclosures
- related-party arrangements
- vessel purchase commitments
- accounting-policy changes
These disclosures rarely make the headline.
But they often explain why two companies facing the same freight market can experience very different outcomes.
One may have flexibility.
Another may have locked itself into expensive capacity at the top of the cycle.
One may have protection.
Another may have hidden operating leverage embedded in long-dated commitments.
The difference is often knowable before the earnings narrative catches up.
What analysts should interrogate before the next turn
A useful shipping review should go beyond volume and headline rates.
At minimum, we would want to understand:
- how much vessel capacity is owned versus chartered
- when major charter commitments reprice or expire
- how current charter rates compare with spot conditions
- where refinancing sits relative to the freight cycle
- whether impairment assumptions still reflect current economics
- how guarantees and off-balance-sheet commitments are structured
- whether hedging meaningfully changes downside exposure
- whether accounting changes have broken historical comparability
None of these questions requires predicting the freight market.
They simply improve the quality of the evidence being used to make the decision.
The Helmledgers approach
Helmledgers is built to interrogate the accounting and disclosure layer beneath headline financial metrics.
Rather than simply summarising filings, the platform is designed to surface:
- unusual accounting treatments
- material changes in disclosures
- hidden obligations
- source-linked evidence
- changes versus prior filings
- questions worth putting to management
For cyclical industries such as shipping, the most useful signal is often not the headline number itself. It is the relationship between the number, the obligation behind it, and the assumptions supporting it.
The headline tells you what happened.
The filing can tell you where the pressure is building.